
⦁ KNERLER, Kathryn; PARKER, Ingrid; ZIMMERMAN,
Carson. 11 Strategies of a World
-Class Cybersecurity Operations Center
Publication date: March 31. from 2022.Mitre
Available at:
https://www.mitre.org/news..
Accessed on: 23 Mar. 2023.
⦁ SEASONED CYBERSECURITY
PROFESSIONALS (SCSP).
SIEM Use Cases. Publication date:
14 Feb. from 2020.
Github SCSP. Available at: https://github.com/scspcom..
Accessed on: 23 Mar. 2023.
⦁ ALVES, Felipe.
Why use data flow
ffor monitoring?
Publication date: 3 Feb
from 2023.
Base 4 Security Research.
Available at: https://www.base4sec.com/research..
Accessed on 23 Mar. 2023.
⦁ ALVES, Felipe.
Stream data on servers.
Publication date: 18 Mar.
from 2023
Base 4 Security Research.
Available at: https://www.base4sec.com/research
Accessed on 23 Mar. 2023
⦁ MITRE, 11 Strategies
of a world-class cybersecurity
operations center.
Publication date:
April 2022.
vailable at: https://www.mitre.org/sites/..
We reached the last article in the series of posts about data-flow. The idea of this last post is tto present the analysis of some data graphically from captures similar to those carried out in the second post of this series. With this observation, it will be possible to extract some use cases for monitoring, analysis and response to potential security threats.
Thinking about a monitoring environment, the data flow can bring a lot of value by bringing the statistical summary of the connections that occurred in an environment, all this at a relatively low cost, since most organizations have equipment capable of exporting this type of data. The observation of this type of information, which shows practically in real time what is going through the network, can contribute and complement the data collected via logs and other forms of monitoring, filling in some gaps, such as:
• Find unknown/unauthorized devices within the environment;
• Monitor the most used protocols/services;
• Identify misuse/policy violations;
• Draw baselines of the usage pattern of network users;
• Draw baselines of daily/weekly/monthly traffic volume;
• Identify traffic anomalies, such as devices that are transporting suspicious volumes of data, among other things.
Apart from all contributions from a security point of view, we can use the data provided to troubleshoot and identify routing problems, also for network capacity planning, since it is possible to observe usage trends and traffic patterns, and finally, manage the bandwidth consumed by the environment.
Compared with approaches where log analysis is preferred, it is important to highlight again that traffic analysis is a complement, where we seek to observe what happens in real time and without the need to configure each device individually to obtain information. In this regard, traffic analysis is a little more direct and brings more visibility to the locations where logs are not being captured, , or for activities that simply don't leave a trace in logs, such as a malicious device infiltration, access points and fake routers etc. Still, compared with a conventional traffic capture, using the PCAP format, which is more complete and helps us rebuild a connection the way it occurred, including the data/files that passed through there, the data flow brings greater simplicity and savings in terms of disk storage. More information can be found at the first post of this series.
The importance of traffic analysis
PArguably, the main motivation for monitoring traffic, logs, and any other data source is to increase visibility into the environment. In a few words: know what's going on. Typically, the person responsible for delivering this type of information is what we know as the Security Operations Center, or simply SOC, which is the central point for detection, analysis and response to incidents, and is the place where all relevant information about the assets of the organization is concentrated, analyzed and treated.
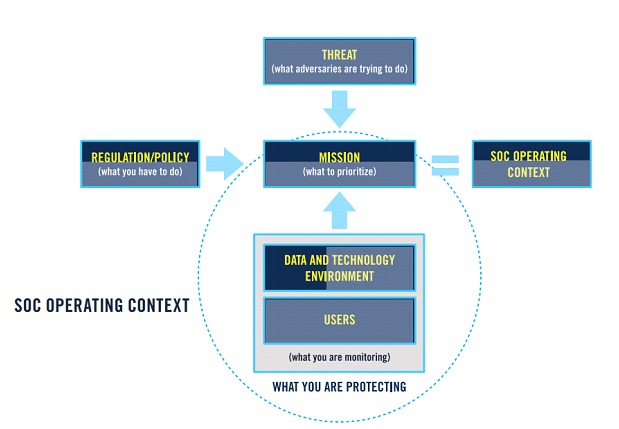
MITRE, in its recent ebook “11 Strategies of a World-Class Cybersecurity Operations Center Highlights”, of 2022, which suggests strategies to bring more efficiency to a SOC, says, in strategy number 1, that “It is necessary to know what we are protecting, and why”. In the subitem "Technical and data environment”, we found a good reason to analyze the traffic, since, knowing what the organization has in terms of technology, it is possible to discover what does not belong to the environment through this analysis. In the subitem "Users, user behaviors, and service interactions” is the reference to the user-service, user-user and service-service behavior baselines. In the subitem "Threat”, there is a need to classify and understand the data in transit and its relationships with possible threats.
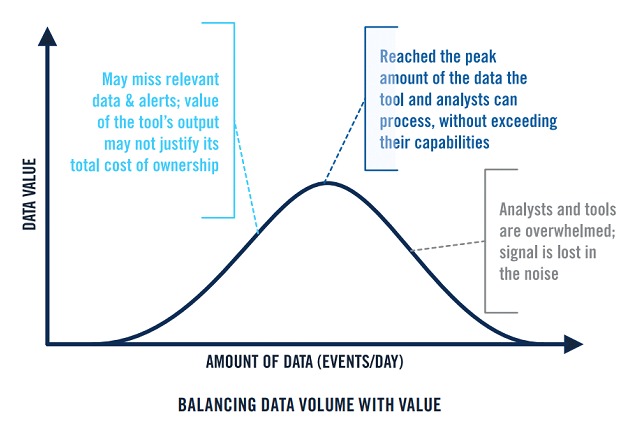
In strategy number 7, “Select and Collect the Right Data”, the document highlights the importance of collecting data based on its value to the organization. Here, the good relationship that must exist between traffic capture vs log capture is clear, since for intrusion confirmation purposes, the most relevant and granular data is normally found in the logs of the endpoints. However, it is also highlighted that the monitoring must collect data from all relevant environments, which includes equipment that generates data flow. It is important to note that more data does not necessarily bring more value.
Finally, data flow, along with other data sources, can help the organization to achieve “situational awareness” about the monitored environment. It is necessary to combine the various analysis and collection strategies to arrive at a satisfactory result that delivers visibility to most of the environment.
Data flow use cases
In the second article in the series of posts about data flow, data was captured in a laboratory environment, but this data was not part of any type of analysis in that post.
In this section, some use cases that can be satisfied using data flow will be shown, illustrating this approach from a capture of these flows carried out in the same manner as the previous post and sent to an analysis software, in this case, the Elasticsearch stack, which has the capacity to receive, translate and generate visualizations for the data inserted in it.
For context, below is the schematic of the lab environment where the data was captured:
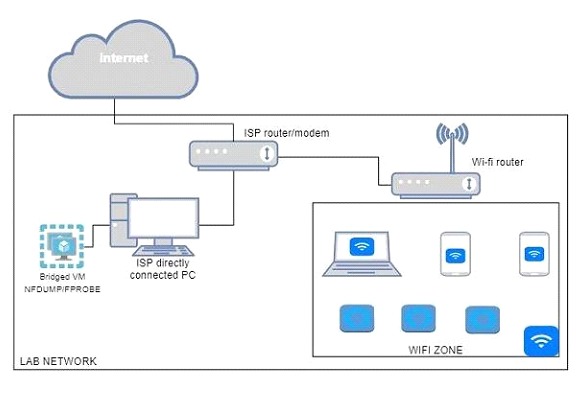
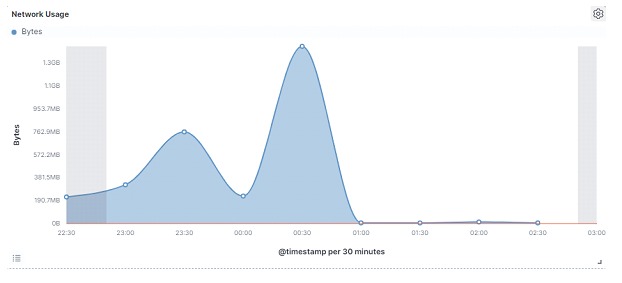
The data this time was captured for a period of just over four hours, quite short compared to the previous one, which was more or less three days. Below are some charts that can be used as monitoring use cases:
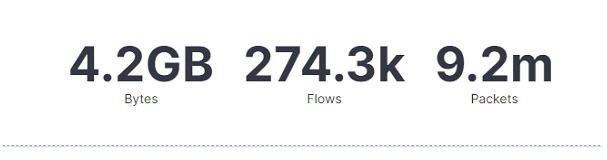
In the graph above, it is possible to observe the volume of data that travels in the captured period. It may seem like simple information, but it is a monitoring possibility to start tracing a baseline of the volume of network usage. This graph can be the basis for more granular ones, such as bytes per protocol, IP addresses that use the network the most, and so on.
One more graph of network usage, for a view over time (baseline):
In the graph below, it is possible to observe which were the most used protocols (in bytes) in a three-hour period:
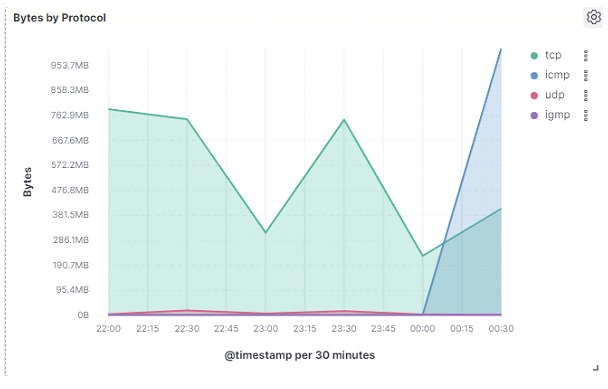
There is an exponential rise in the volume of ICMP protocol traffic from a certain period on the chart. This was due to ICMP flooding carried out as a test, to show the effectiveness of this type of monitoring for detecting anomalies in the network.
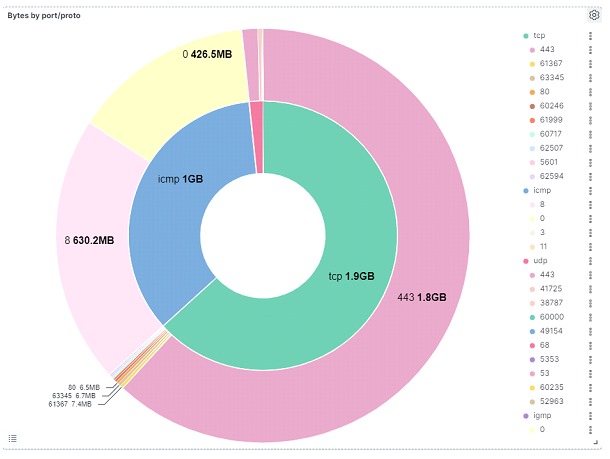
Complementing the protocol information, it is possible to visualize in the figure below, information of which ports / codes are linked to which protocols, and to have an idea of the amount of data that is traveling in these ports/protocols to detect possible problems, in addition to helping in the creation one more baseline behavior for this topic In the table below, it is possible to identify which were the addresses responsible for the largest data transmissions in the period. It is remarkable the amount of data transferred using the ICMP protocol, something that would draw attention to a dashboard.
In the table below, it is possible to identify which were the addresses responsible for the largest data transmissions in the period. It is remarkable the amount of data transferred using the ICMP protocol, something that would draw attention to a dashboard.
This information is relevant because:
• Can help profile users' network usage;
• Shows which types of protocols were most used by each address;
• It can also help to detect unauthorized equipment using the network, information that will not always be available through logs.
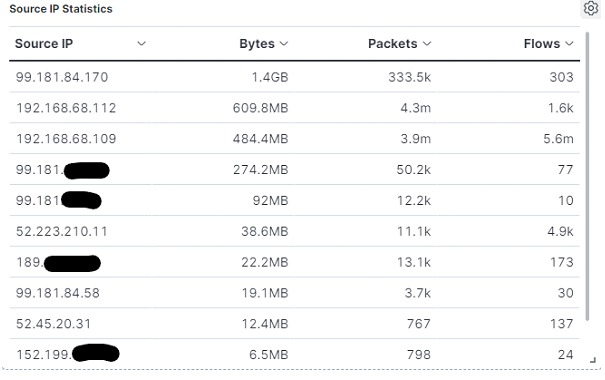
It is important to note that the amount of bytes, packages and data flows will not always be proportionate. This type of information is also important to identify connection anomalies or even malicious traffic. For example: a malicious data exfiltration activity could generate a high amount of packets and data flows, while keeping a low volume of bytes. This information can, and should, be cross-referenced with logs to identify and handle a potential incident. As a matter of curiosity, the first IP shown in the table belongs to a streaming: during the entire period of the test, a computer on the network was connected to the platform, with an open real-time transmission, which explains the excessive amount of data transmitted, proving that it is possible to draw a usage profile aimed at the user activity.
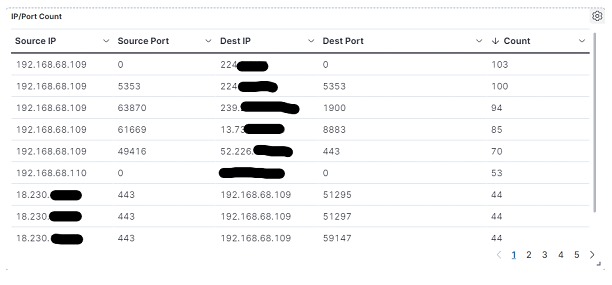
The table below shows the connection count relationship between addresses, being source IP/port and destination IP/port. This visualization can be important to identify anomalies of lateral movement, activity of malware, command and control, and other problems,in addition to bringing an understanding of the relationshipsuser, user-service, and service-service cited above. The table provides an excellent opportunity for threat hunting activities where the analyst needs a little more proactivity to carry out his searches. It can also be cross-referenced with a list of Indicators of Compromise (IoCs) obtained through Threat Intelligence (CTI) activities, and so on.
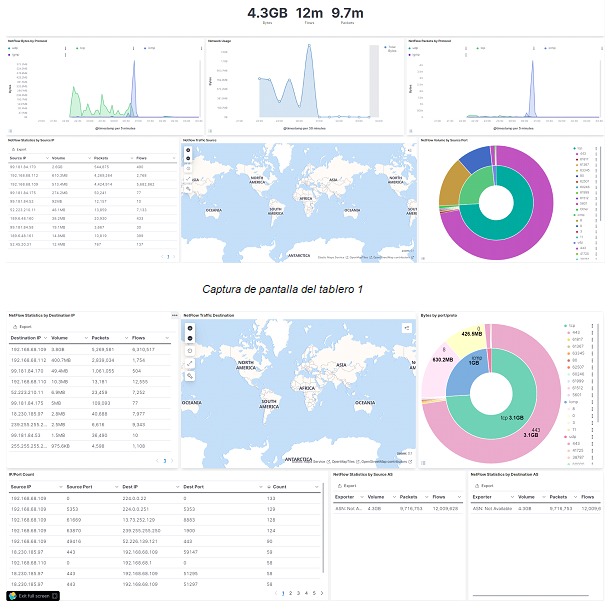
Below is a full preview of the dashboard that can be implemented to assist a monitoring / handling / response / threat hunting team in carrying out their searches and investigations.
Besides the dashboard, manual searches can be done to find specific terms. It is worth remembering that data flow offers many more fields than those shown in this post. For this publication, they were obtained from a Linux server using open source tools like fprobe, and itself delivers very scarce information when compared to data obtained from specialized equipment with greater capacity for this type of data, such as routers and switches, from which it is possible to obtain information such as:
• Source and destination Autonomous System Number (ASN);;
• Geolocation coordinates;
• MAC addresses (next hop);
• Monitoring connections by country;
• And many others.
It is possible to conclude that the data flow proved to be another essential data source for monitoring, analyzing and responding to possible security incidents in an organization, in addition to being able to assist in the generation of compromise indicators and in threat hunting activities. It can be an alternative to capturing traffic at a few points in the network to help identify security threats, analyze long-term network traffic, manage network bandwidth, plan network capacity, and monitor policy compliance, safety and regulations.
To take full advantage of the characteristics of streaming data, it is important to identify how it fits the business and what use cases it can satisfy, identify the best exporting equipment, as well as collecting and storing data in a centralized location, analyzing regularly and keep security policies up to date, always integrating this analysis with the organization's other data sources.
In summary, through the simple monitoring use cases shown in the graphs, it was possible to see that the implementation of data flow capture, combined with recurring analysis, can help organizations to reduce security risks and improve the effectiveness of monitoring activities. monitoring, detection and response to potential threats.

